First off, this data analysis project has been taken by "Code Basics" which is a youtube channel. You can access it using below link
We are going to cleanse and visualize our data by using Microsoft Power BI as an exercise. In addition to that, as a database, we will be using MySQL to analyze our data.
As a feedback for the youtube channel (codebasics), I have really enjoyed with the whole series which gave me a good insight to comprehend how data analysis works by using data science tools. So, this has been a good starting point to dive into data science.
-
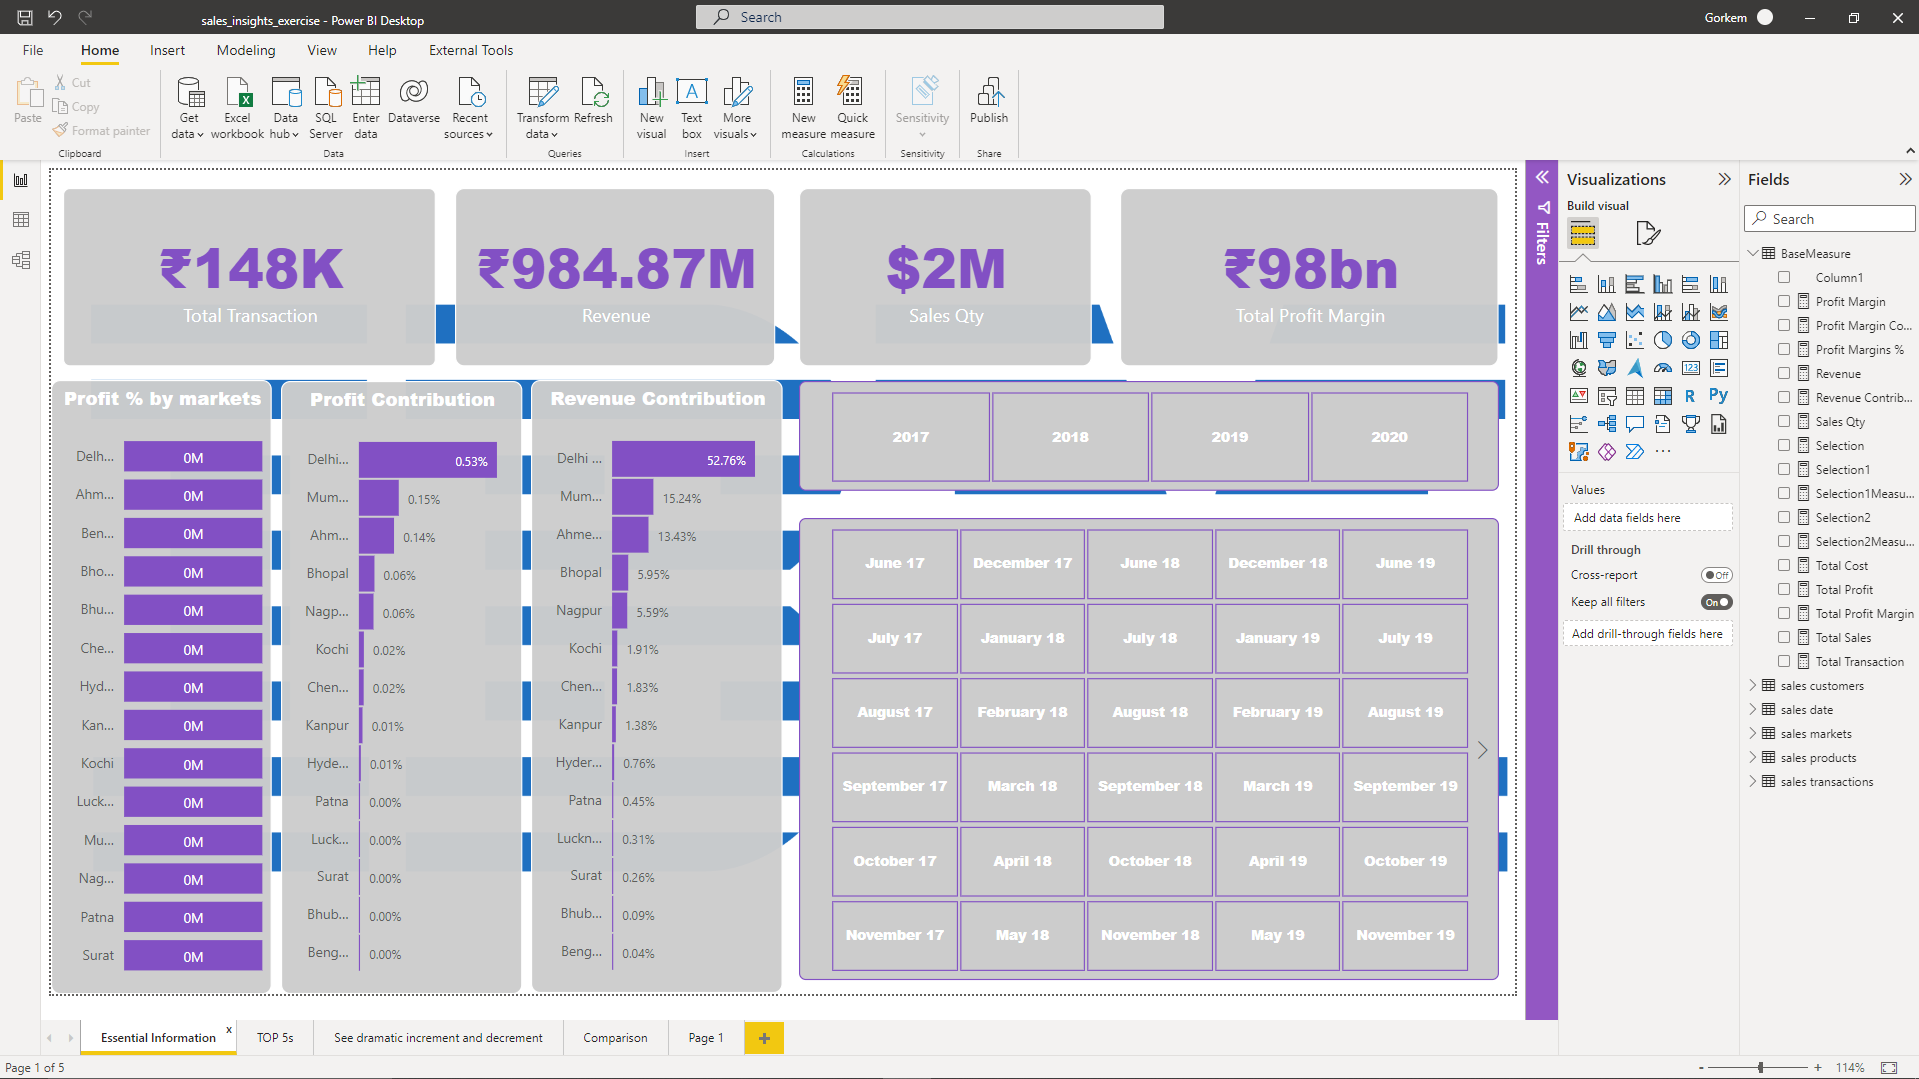
Use this code :
Total Transaction = COUNTROWS('sales transactions') -
Use this code :
Revenue = SUM('sales transactions'[sales_amount]) -
Use this code :
SELECT SUM(sales_amount) FROM transactions as trns INNER JOIN date as dt ON trns.order_date = dt.date WHERE dt.year = 2020) -
Use this code :
SELECT DISTINCT(year) FROM date -
Use this code in Microsoft Power BI :
Profit Margins % = DIVIDE([Total Profit Margin], [Revenue], 0) -
Use this code in Microsoft Power BI :
Profit Margin Contribution % = DIVIDE([Revenue], CALCULATE([Total Profit Margin], ALL('sales products'), ALL('sales customers'), ALL('sales markets')))