This project is currently under development and is partially ready for production use.
- TCP services
- HTTP/1.1 services
- UDP services
- ICMP monitors
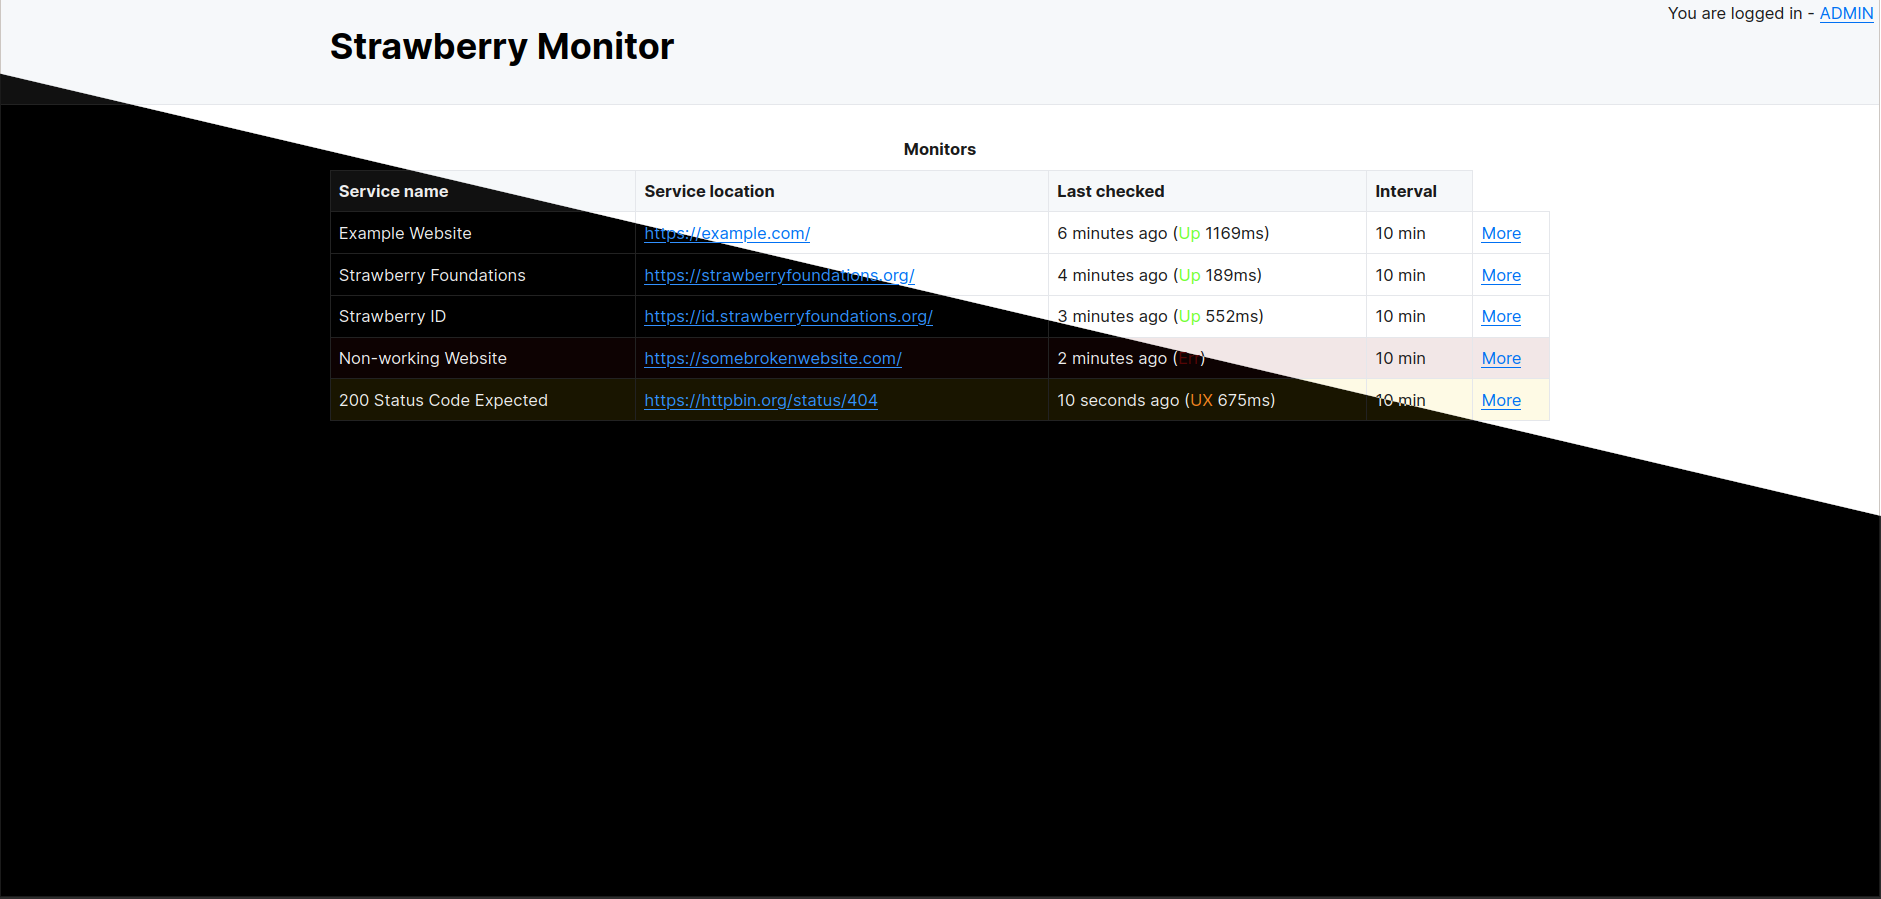
- Start page with status of all monitors
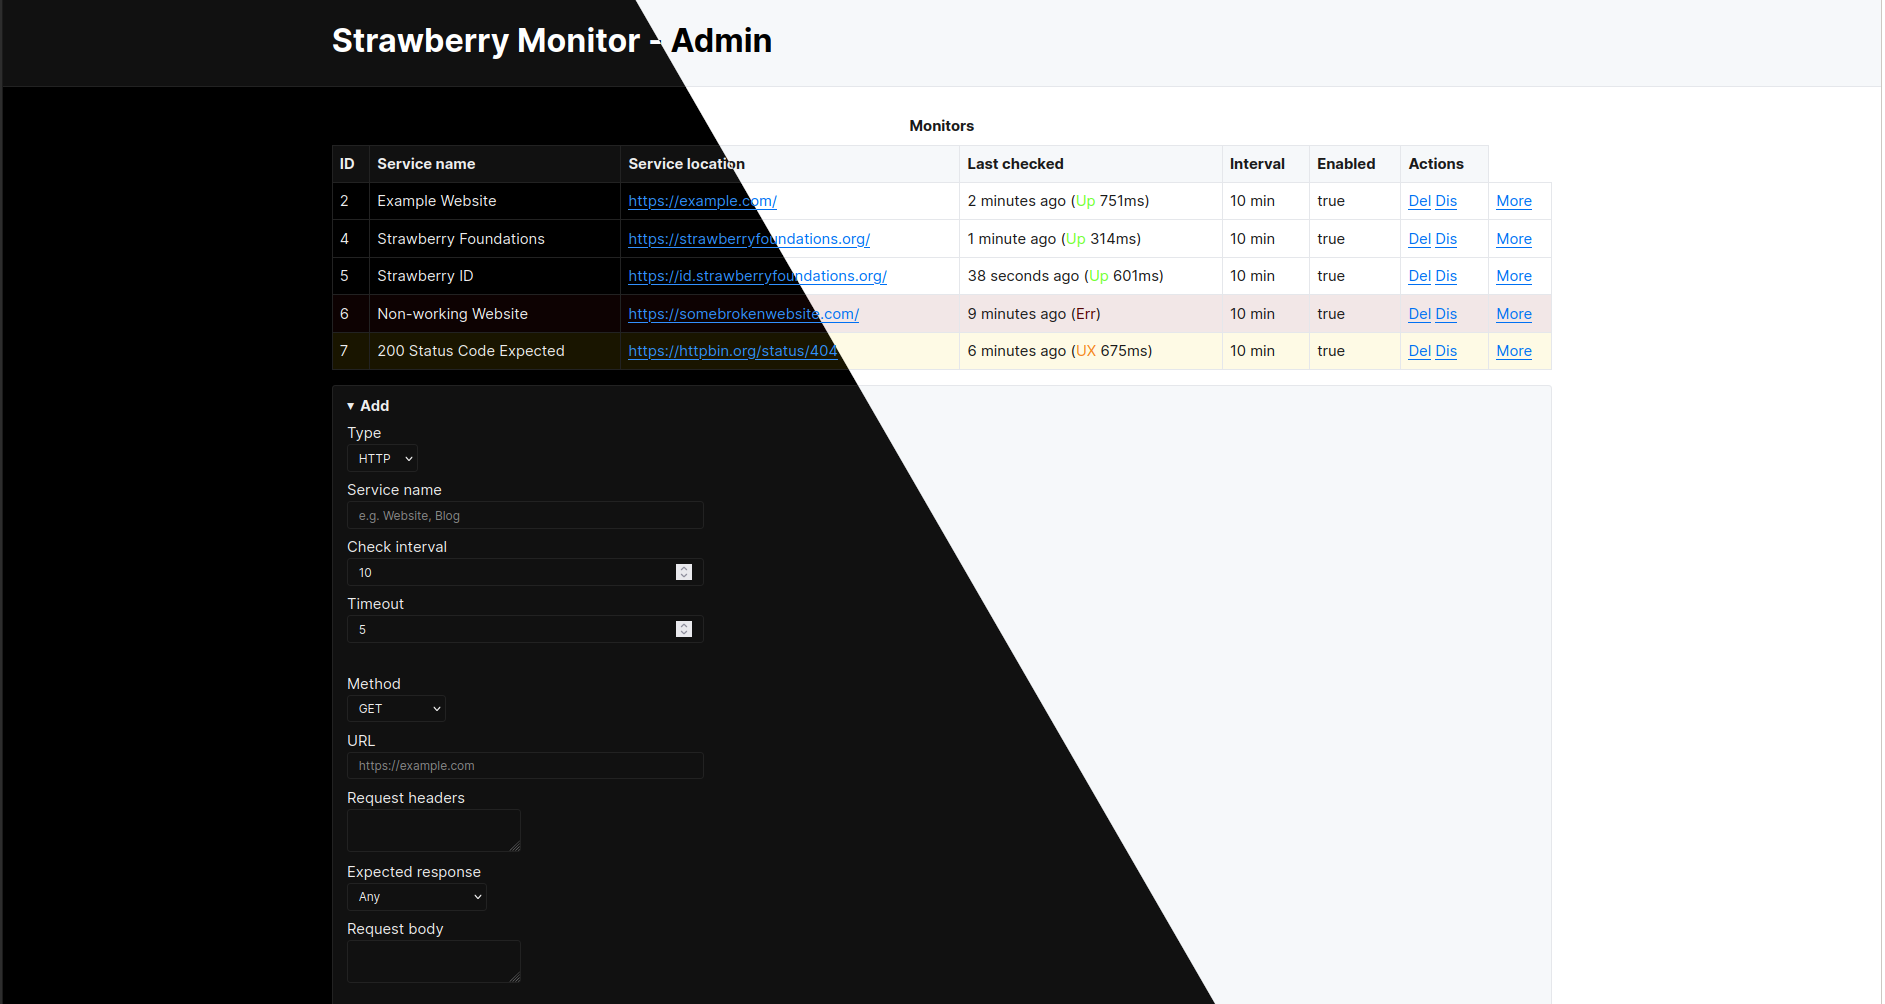
- Admin interface which allows you to add and manage monitors
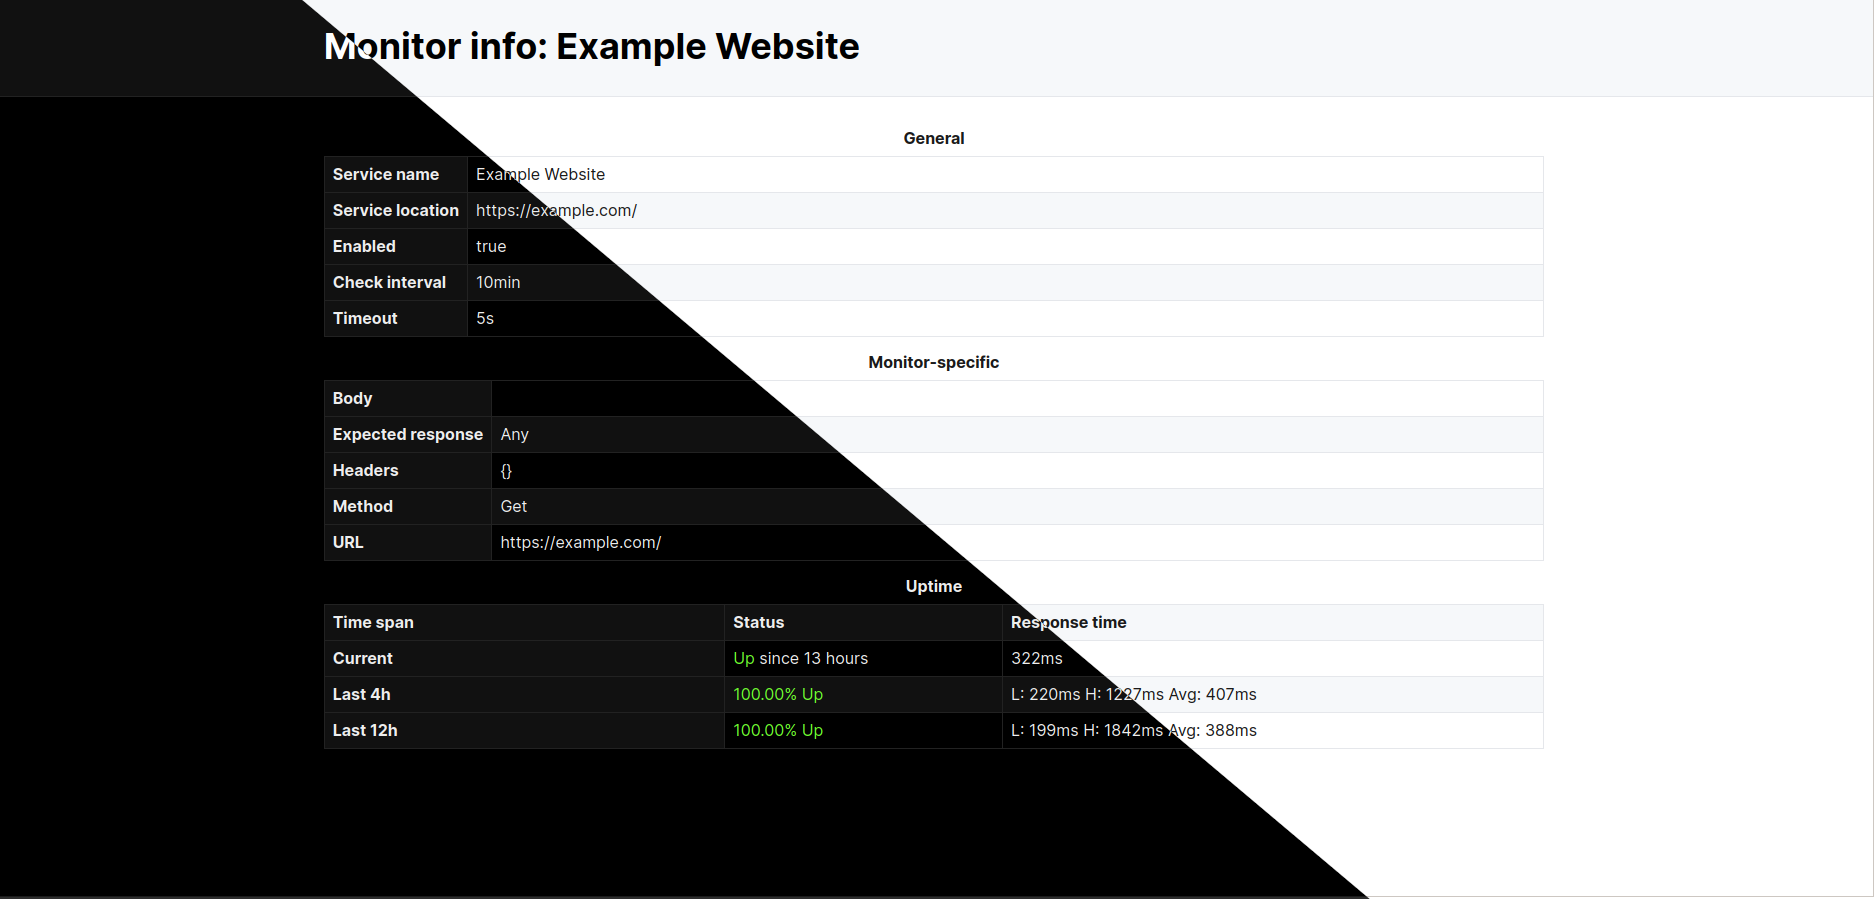
- Monitor page where you can see the uptime history of a monitor
- Allow editing of monitor options
Strawberry Monitor is a simple uptime panel that allows you to monitor the uptime of services. As of writing this, it only supports TCP and HTTP, but UDP and ICMP support is planned.
- TCP and HTTP service monitoring (UDP and ICMP support planned)
- Web-based dashboard
- Configurable check intervals
- Authentication for administrative functions
Strawberry Monitor aims to provide:
- 🚀 Simplicity: Minimal setup, fast deployment
- 🎯 Focus: Core monitoring features without bloat
- 🪶 Lightweight:
- Uses SQLite as database
- Low resource consumption (uses 15MB of memory)
- No client-side JS required for read-only
- 📊 Clarity: Clean, minimal web interface built on new.css
Perfect for small to medium infrastructures and developers seeking a straightforward monitoring solution.
- Monitor: A task that checks a service at defined intervals
- Interval: The minimum time between checks
- Check: Process of verifying service availability and response
It's really simple! Set up the config in stbmon.toml.example as you like, rename it to stbmom.toml then run it with cargo run --release. The database is automatically created.
Make sure that you have installed libsqlite3-dev (or similar) on your system.
Open the web UI by going to the address defined in stbmon.toml (default is http://0.0.0.0:13337). From there, you can view your monitors, and after logging in with the password defined in the config, you can add, delete and edit monitors.