![]()

You can place the downloaded app bundle in a location of your choosing (e.g., the Applications folder on macOS or ~/.local/share/applications on Linux). When you launch CodeTracer, it will prompt you to complete the final installation steps, such as adding the command-line utilities to your PATH.
CodeTracer is a user-friendly time-traveling debugger designed to support a wide range of programming languages.
It records the execution of a program into a sharable self-contained trace file. You can load the produced trace files in a GUI environment that allows you to move forward and backward through the execution and to examine the history of all memory locations.
Compared to traditional debuggers, CodeTracer gives you two major superpowers:
-
Once you capture a bug in a recording, consider it squashed!
Bugs that are hard to reproduce can be painful to fix — you’ve surely been there. Once such a bug is captured with CodeTracer, you'll rarely need more than 30 minutes to track it down! This is largely a consequence of the next superpower:
-
Most bugs are easily revealed when you know the origin of any value in the program.
All programs produce output. Some examples are bytes generated as a response to a web request, pixels being drawn on your screen or perhaps a simple log line written to the terminal.
When CodeTracer creates a recording, it captures a user-extensible set of output events relevant to the program. The GUI displays these events in a searchable chronological event log.
Consider a misbehaving program that prints unexpected output to a log file midway through its execution. Clicking on the specific output event in CodeTracer will take you to the precise moment and code line where it was generated.
The unexpected value must be originating from some variable that's being passed to the logging function. With CodeTracer, you can now ask the question "Where did this value come from?". CodeTracer will find another moment in the execution, potentially multiple seconds earlier, in a completely different part of the program where this particular memory location was last written to.
This could be memory corruption or a genuine logical error. Either way, CodeTracer will report the origin. Let's say that you end up in the correct function that is responsible for computing the problematic value, but another input there leads to the issue. You can continue the search by repeating the question "Where did this input come from"? It usually takes just a few of these jumps to earlier moments in time to arrive at the root cause for the bug.
Every time you jump to a new moment in the execution, you can fearlessly explore your surroundings by stepping forward or backwards, having access to a back button that can always get you to any previous point of interest. At every point of the journey, our novel UI shows you details about the past and future program states at a glance and you know your position in the precisely recorded call trace of the program.
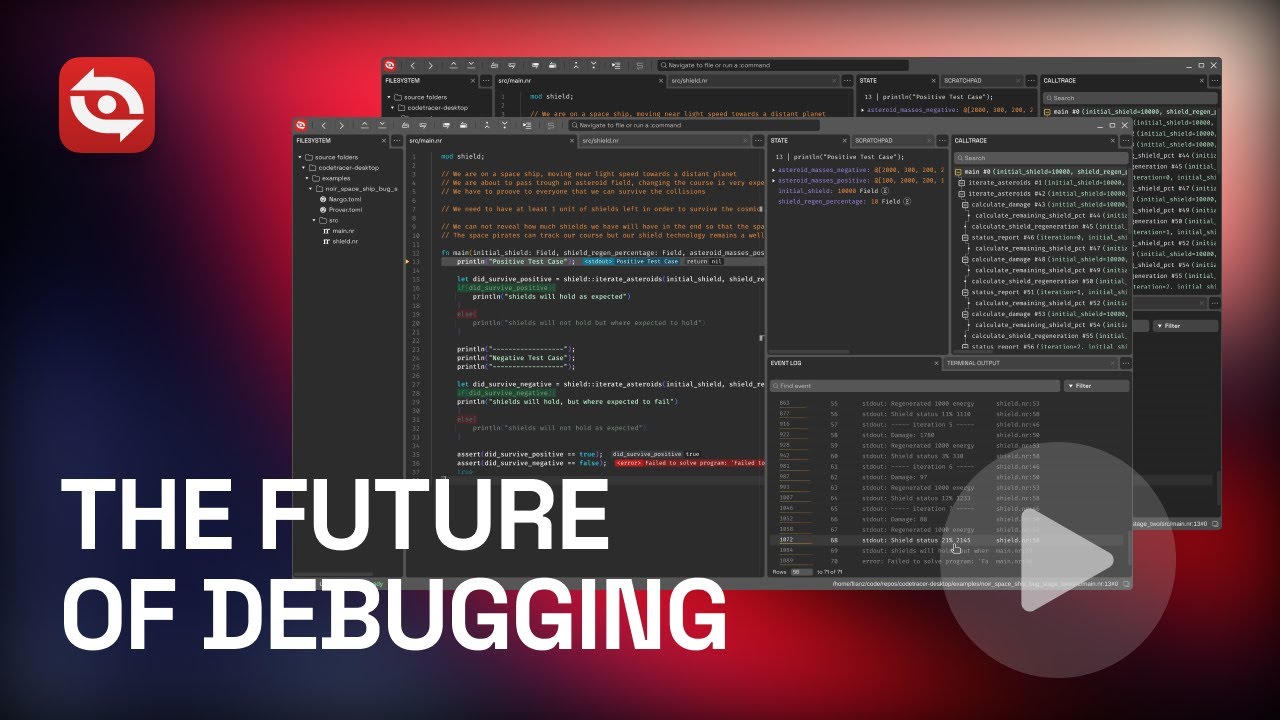
These features combined, make for a truly powerful debugging experience, which we invite you to see in the video below:
The initial release of CodeTracer supports the Noir programming language. It has been developed in collaboration with the Blocksense team and currently requires the use of the Blocksense Noir Compiler, which is included in the CodeTracer distribution.
CodeTracer’s open-source development is made possible by the generous support of Aztec Network, Arbitrum Foundation, and Aptos Foundation. During 2025, CodeTracer will evolve into a comprehensive Web3 development toolkit by gaining support for many additional smart contract and zero-knowledge programming languages. Most of its functionality will be packaged into reusable libraries that will power the creation of block explorers with advanced transaction tracing capabilities and omniscient debugging plugins for Visual Studio Code and other IDEs.
CodeTracer uses an open format for its trace files and we've started several community-driven projects which aim to add support for other programming languages:
Metacraft Labs is also developing an alternative back-end, capable of working with [RR] recordings, which will make CodeTracer suitable for debugging large-scale programs in a variety of system programming languages such as C/C++, Rust, Nim, D, Zig, Go, Fortran and FreePascal.
To shape our priorities and to help us understand the demographics of our user base better, please fill out CodeTracer Developer Preferences Survey.
To accelerate our development, please consider donating to our Open Collective campaign. Anyone who contributes more than $50 before June 2025 will get early access to our beta releases for system programming languages, forever.
[Open Collective Donate Button]
Once you have time travel, you can re-imagine how a debugger works from the ground up! Here are some of the features of CodeTracer that set it apart from traditional debuggers:
When CodeTracer breaks at a certain line of code, it knows not only the past but also the future. You can immediately see the values of all variables in the current function right next to the source code. This includes variables in loops where you can easily scroll through the iterations. Taken code branches are highlighted, while the non-executed code is immediately grayed out.

Many developers tend to transition from using interactive debugging early on in their careers, to mostly relying on carefully placed print statements as they start to face harder problems in distributed and real-time systems.
CodeTracer gives you the best of both worlds. A tracepoint allows you to see the effects of adding additional code to your program, without recompiling and rerecording it.
The added code can feature if statements, additional function calls and various ways to print or plot the captured data. The output is typically produced in seconds.

Instead of a stack trace limited to a single moment in time, CodeTracer shows you the entire tree of function calls in the recorded execution. You can navigate and filter it in various ways and the clever collapsing and expanding algorithms still allow you to obtain a classic stack trace whenever you need it.

Every variable in CodeTracer has a history. You can see all the values that the variable held during the entire execution of the program and for each of them you can jump to the originating expression that computed it. CodeTracer follows the path of trivial copies in assignments to save you extra time when tracking down more convoluted bugs.

The event log gives you a chronological view over anything of interest in your program, interleaved with the tracepoint outputs. Clicking on any event takes you to the precise moment in time when it was produced, which gives you excellent starting points for your investigations. Tracking down the origins of anomalous events and program states through the history of the involved variables is the essence of debugging with CodeTracer.

The terminal output panel renders the recorded stdout and stderr events like a standard terminal. Clicking anywhere in the output takes you to the exact moment when the specific character was generated. This allows for a fallback to a more traditional print-style debugging when the expressivity of tracepoints is not sufficient. In the future, CodeTracer will allow you to slide through the states of the terminal through time which will help for debugging highly interactive TUI apps.

Since CodeTracer is aware of all past and future control flow, it offers some convenient shortcuts for quickly navigating the program execution by interacting with its source code:
- Jump to a line: Middle-click on any undimmed line in the current function to quickly step to it. If you use a mouse without a middle button, you can achieve the same with
Ctrl+Clickor by pressingCtrl+F8(as a special kind ofcontinue) after navigating to the respective line with your keyboard. - Jump into a call: Double middle-click on the function name in a call expression to jump into it. If you use a mouse without a middle button, you can achieve the same with
Ctrl+Alt+Clickor by pressingCtrl+F11(as a special kind ofstep-in) after navigating to the respective call expression with your keyboard.
Explore the right-click context menu for additional operations.
The scratchpad provides a play area where you can pin values from different locations and moments in time. You can explore their differences both manually and algorithmically to gain quick insights into the behavior of your program.
When you launch the CodeTracer GUI, it will offer you the option to also install the CodeTracer CLI. It provides convenient ways to create and load trace files from the command-line or to integrate CodeTracer with CI processes.
Run ct --help to see the full list of supported subcommands, but the most commonly used ones are the following:
<application> can be a source file or a project folder (depending on the language):
ct run <application>- Creates a recording and load it in CodeTracer with a single command.ct record <application>- Creates a trace file that can be loaded later or shared.ct replay- Launches the CodeTracer GUI with a previously recorded trace file. Common usages are:ct replay- Opens a simple console-based dialog to choose what recording you want to replay.ct replay <program-name>- Opens the last trace of an application.ct replay --id=<trace-id>- Opens a trace by its trace id.ct replay --trace-folde=<trace-folder>- Opens a trace by its trace folder.
ct- Launches the startup screen of the CodeTracer GUI.ct help / ct --help- Gives you a help message.ct version- Returns the current version of CodeTracer.
You can learn all CodeTracer keyboard shortcuts by examining the main menu and the tooltips over all buttons in the interface. The default configuration should be familiar to users experienced with Microsoft Visual Studio™.
Since CodeTracer provides a reverse counterpart to most traditional debugging operations, we typically use the Shift modifier to indicate this (e.g. F10 is "Next Step" while Shift+F10 is "Previous Step").
The user config file located at ~/.config/codetracer/.config.yml allows you to specify custom shortcuts for all operations.
The Metacraft Labs team is using Nix to define a reproducible development environment for working on CodeTracer. Linux is our primary development platform, while some of our team members use macOS. Building on Windows will be supported in the near future.
To enter the Nix development environment, perform the following steps:
- Install Nix.
- Clone this repository.
- At the repository root, execute
git submodule update --init --recursive. - At the repository root, execute
nix develop(ordirenv allowfor users ofdirenv). - In the resulting shell, you can build all targets by running
just build-onceorjust buildif you intend to make continuous changes to the source code.
Check out our Contributors Guide for more details.
CodeTracer is distributed under the GNU Affero General Public License (AGPLv3).