Theódór Magnússon - theodorm14@ru.is
Implementation of the k-means clustering class
The algorithm was implemented as a javascript class, class K(X, K, Niters). The class is constructed with three variables, X is the two dimensional data matrix that is to be classified. The K variable represents the number of prototypes (classes) to classify and finally the Niter wich in our case automatically runs Niter number of steps of the algorithm when constructed.
For demonstrational purposes the steps are intervaled on one second each step so that the progress can be seen live. The following link is to a live version of the whole project, with three datasets and manual eStep and mStep buttons.
http://sandbox.codelab.is/data/kmeans/
- Initialize the prototypes. You can, for example, pick K random data points as your initial prototypes.
- Calculate a distance matrix whose elements contain the Euclidean distance from each datapoint to the prototypes.
- E-step: Compute the responsibilities from the distance matrix. (See Eq. 9.2 in Bishop).
- M-step: Recompute the prototypes using Eq. 9.4 and the responsibilities calculated in the E-step.
- Repeat the previous three steps Niter times.
In this implementation, the prototypes are given random location within the scale of the current dataset. This was added after troubles with the iris dataset, where most often one of the three prototypes would be outweight by the other's ending up "outside" the chart.
The code can be found at the bottom.
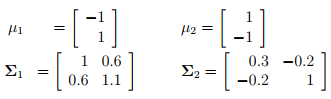
The function generateData() generates the two following datasets and labels them:
generateData = () => {
	let data = [];
	for(i = 0; i < 75; i++){
	  	data[i] = {
	  		x: randomGaussian(-1,1),
	  		y: randomGaussian(1,1.1),
	  		actual: 'cluster1'
	  	}
  	}

	for(i = 0; i < 150; i++){
		data[75+i] = {
			x: randomGaussian(1,0.3),
			y: randomGaussian(-1,1),
			actual: 'cluster2'
		}
	}
	return data;
}
The following image shows the dataset classified by the algorithm after 6 steps. At that point the algorithm did not further move the prototypes nor re-compute the responsibilities.
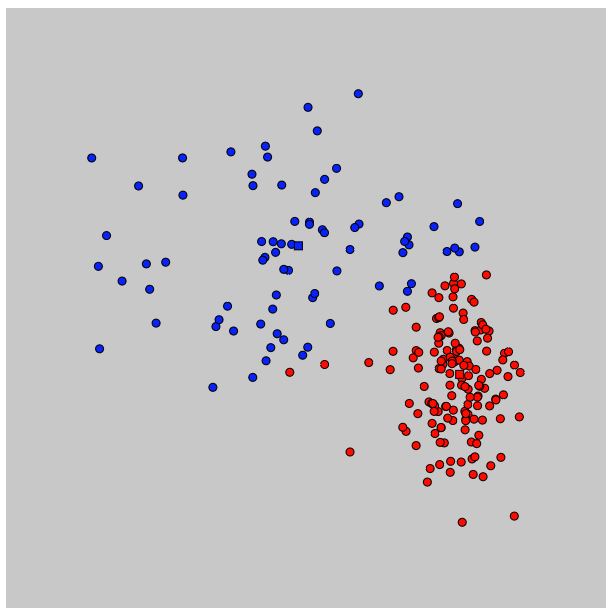
The squares represent the prototypes, colors the current classification and dots the actual data points.
b) Compute J using the responsibilities and the distance matrix. Plot this for each iteration. How many iterations are appropriate? Can you design another stopping criterion?
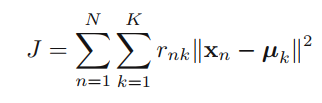
While running the function computeJ() on every step these values for J came to be. After 4 steps the J stopped changing as the protypes and their datapoints have "gathered" closely enough so that the prototypes isn't changing in the e step.
- 651.50
- 387.56
- 301.97
- 297.99
A good stopping criterion would be that at the moment J does not change value inbetween iterations, the iterations would stop.
computeJ() is a class function for the kmeans algorithm.
computeJ() {
	// J represents the sum of the squares of the distances of
	// each data point to its assigned vector µk.
	let j = 0;
	this.data.forEach(x => {
		this.prototypes.forEach((mu, k) => {
			(x.label == k) && (j += pow(dist(x.x, x.y, mu.x, mu.y), 2));
		});
	});
	return j;
}each cluster
This function was used to properly estimate the cluster porportions.
classRationing() {
	// Calculates the ratio between all classes
	let ratio = [];
	this.data.forEach(point => {
		(ratio[point.label] != undefined) ? ratio[point.label]++ : ratio[point.label] = 0;
	});
	return ratio.map(r => (r / data.length).toFixed(2) + '%');
}
It yielded 71% for the red and 29% for the blue when the real ratios are 150/225 (66.6%) and 75/225 (33.3%).
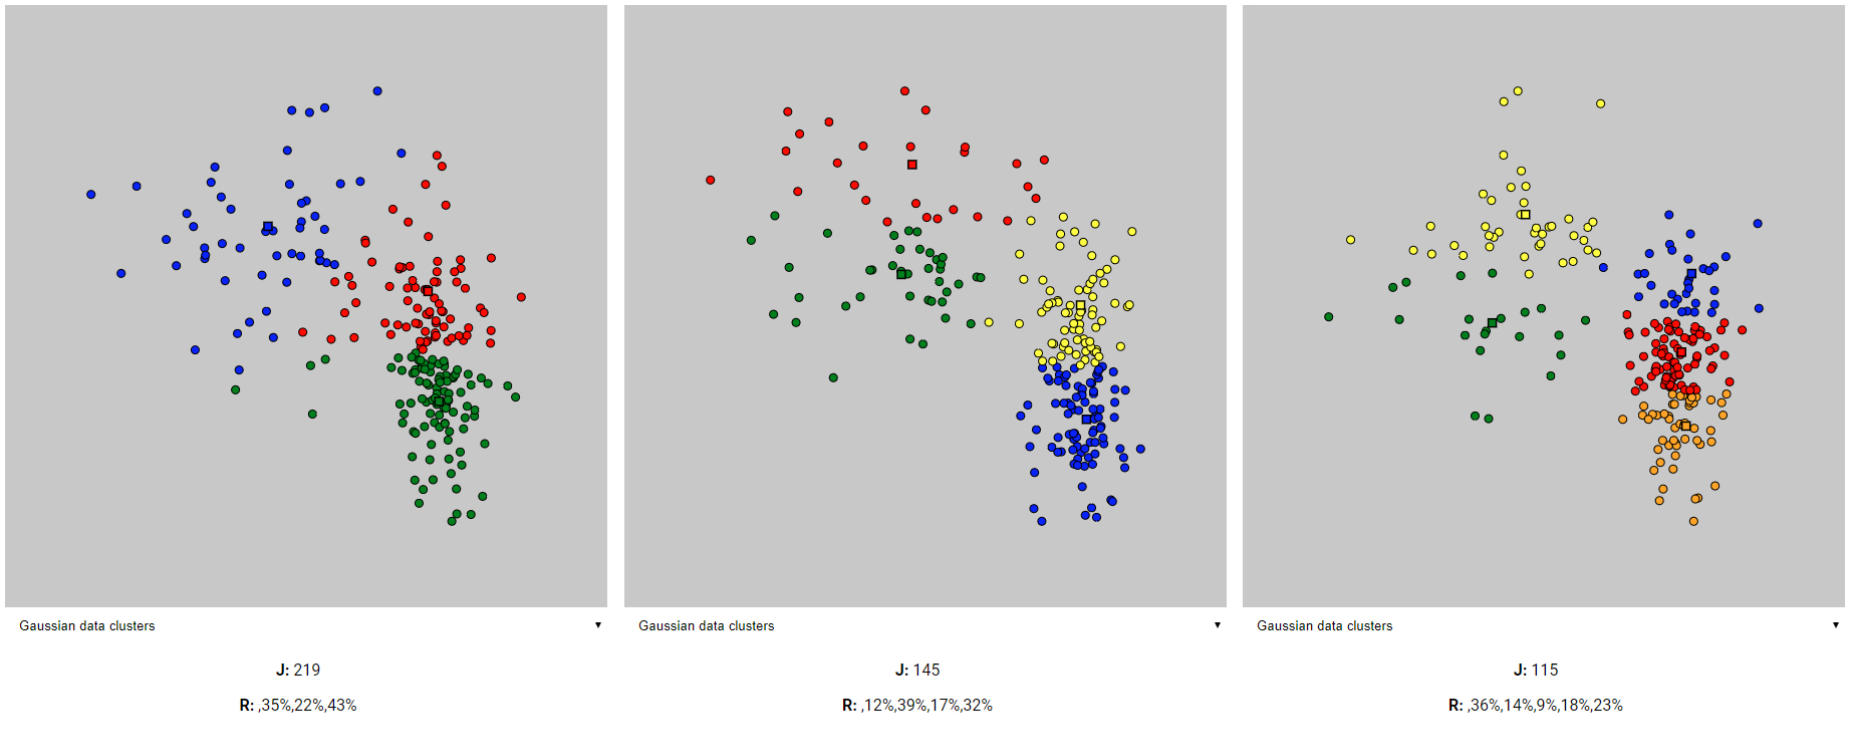
- clusters: J value = 219, Ratios: 35% 22% 43%
- clusters: J value = 145, Ratios: 12% 39% 17% 32%
- clusters: J value = 115, Ratios: 36% 14% 9% 18% 23%
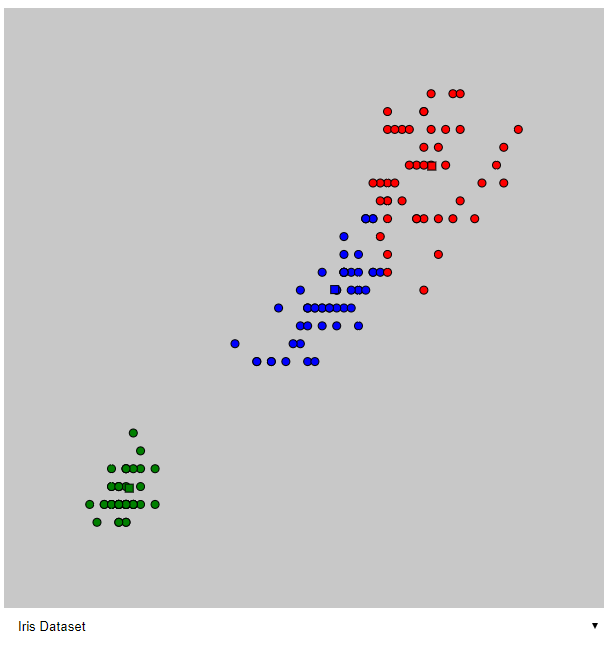
e) Apply the K-means algorithm on Iris database. For what choice of K do the cluster labels correspond to the classes? In this case, compile the confusion matrix and calculate the misclassification rate.
The iris dataset consists of three different species of which we want to classify. That means we want to start off with K = 3 classes.
The image shows the classification after 8 steps in the algorithm. Once again, at a point where following steps did not make a difference.
The following confusion table shows the unnamed three classes on the left corresponding to the number of data points classified for each of the actual species. Where for example 48 versicolor datapoints where classified as class 2 (blue) while only 6 of them were classified as class 1 (red).
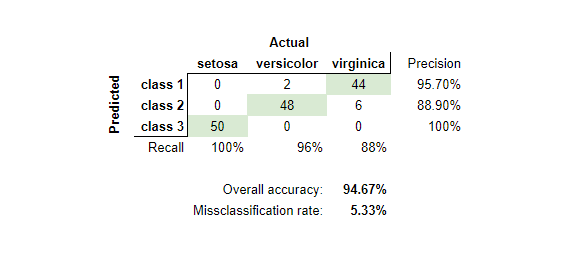
I manually assigned the unnamed classes to the correct actual label from the obvious majority for each case (marked green in the confusion table).
//K-means algorithm
class K {
	constructor(X, K, Niters) {
		// Data includes data set x and the responsibility variable as well
		this.data = X;

		//Initialize the prototypes. K's are picked randomly
		this.prototypes = []; //µ
		let scale = dataScale(this.data);
		for(let i = 0; i < K; i++){
			this.prototypes[i] = {
				x: random(scale.x.min, scale.x.max),
				y: random(scale.y.min, scale.y.max)
			}
		}

		// Training iterations
		if(Niters){
			let iterations = setInterval(() => {
				this.eStep();
				this.mStep();
				Niters--;
				!Niters && clearInterval(iterations);
			}, 400);
		}
	}

	eStep() {
		// Each data point is labelled according to it's closest prototype µ
		this.data.forEach(point => {
			let distances = [];
			this.prototypes.forEach((proto, i) => {
				distances[i] = {i: i, dist: dist(point.x, point.y, proto.x, proto.y)};
			});
			distances = distances.sort((a,b) => a.dist > b.dist);
			point.label = (distances[0].i + 1).toString()
		});
	}

	mStep() {
		// Each prototype is assigned a new value from its class's mean (µ).
		this.prototypes.forEach((proto, i) => {
			this.prototypes[i] = mean(this.data.filter(point => (point.label == i + 1)));
		});
	}

	computeJ() {
		// J represents the sum of the squares of the distances of
		// each data point to its assigned vector µk.
		let j = 0;
		this.data.forEach(x => {
			this.prototypes.forEach((mu, k) => {
				(x.label == k + 1) && (j += pow(dist(x.x, x.y, mu.x, mu.y), 2));
			});
		});
		return j;
	}

	classRationing() {
		// Calculates the ratio between all classes
		let ratio = [];
		this.data.forEach(point => {
			(ratio[point.label] != undefined) ? ratio[point.label]++ : ratio[point.label] = 1;
		});

		return ratio.map(r => Math.round(r / data.length * 100) + '%');
	}

	missClassification(classlabel) {
		// Generates a confusion table from the classification accuracy
		// don't know the class names, go with the most frequent of each prototype.

		let misclass = [];
		this.data.forEach(point => {
			if(point[classlabel] == undefined)
				point[classlabel] = { correct: 0, missed: 0 };

			if(point[classlabel] == point.label){
				misclass[label].correct++;
			} else {
				misclass[label].missed++;
			}
		});
	}
}

dataScale = data => ({
	x: {
		min: Math.min.apply(null, data.map(p => p.x)),
		max: Math.max.apply(null, data.map(p => p.x))
	},
	y: {
		min: Math.min.apply(null, data.map(p => p.y)),
		max: Math.max.apply(null, data.map(p => p.y))
	}
});

mean = points => ({
	x: points.reduce((sum, value) => sum + Number(value.x), 1) / points.length,
	y: points.reduce((sum, value) => sum + Number(value.y), 1) / points.length
});let data = [];
let kmeans;
let scale;
let j, r;
function setup() {
// Init data clusters and kmeans algorithm
data = generateData();
kmeans = new K(data, 5, 3);
// Visual attributes
rescale();
// Init visual DOM
createCanvas(600, 600);
// Buttons and event handlers
const rBtn = createButton('Reset');
const mBtn = createButton('mStep');
const eBtn = createButton('eStep');
const bBtn = createButton('Both');
rBtn.mousePressed(resetData);
eBtn.mousePressed(e => kmeans.eStep());
mBtn.mousePressed(e => kmeans.mStep());
bBtn.mousePressed(e => {
kmeans.eStep();
kmeans.mStep()
});
// Dataset selection
sel = createSelect();
sel.option('Gaussian data clusters');
sel.option('Old faithful');
sel.option('Iris Dataset');
sel.option('World Map');
sel.changed(resetData);
}
function draw() {
// Reseting canvas
canvas.getContext('2d').transform(1, 0, 0, -1, 0, canvas.height);
background(200);
// Drawing datapoints
fill('white');
strokeWeight(1);
kmeans.data.forEach(elem => {
if(elem.label)
labelColor(elem.label)
ellipse(fitX(elem.x), fitY(elem.y), 8, 8);
});
// Drawing prototypes
strokeWeight(1.5);
kmeans.prototypes.forEach((prototype, i) => {
labelColor(i+1);
rect(fitX(prototype.x), fitY(prototype.y), 8, 8);
});
// Updating J value and class ratios
j && j.remove();
r && r.remove();
j = createP(`J: ${Math.round(kmeans.computeJ())}`);
r = createP(`R: ${kmeans.classRationing()}`);
}
// Visual helpers
rescale = () => {
scale = dataScale(data);
scale.x.delta = Math.abs(scale.x.min - scale.x.max);
scale.y.delta = Math.abs(scale.y.min - scale.y.max);
}
fitX = x => ( map(x, scale.x.min - (0.2 * scale.x.delta), scale.x.max + (0.2 * scale.x.delta), 0, 600));
fitY = y => ( map(y, scale.y.min - (0.2 * scale.y.delta), scale.y.max + (0.2 * scale.y.delta), 0, 600));
labelColor = x => {
switch(Number(x)) {
case 1:
fill('red');
break;
case 2:
fill('blue');
break;
case 3:
fill('green');
break;
case 4:
fill('yellow');
break;
case 5:
fill('orange');
break;
case 6:
fill('pink');
break;
case 7:
fill('cyan');
break;
}
}
generateData = () => {
let data = [];
for(i = 0; i < 75; i++){
data[i] = {
x: randomGaussian(-1,1),
y: randomGaussian(1,1.1),
real: 'cluster1'
}
}
for(i = 0; i < 150; i++){
data[75+i] = {
x: randomGaussian(1,0.3),
y: randomGaussian(-1,1),
real: 'cluster2'
}
}
return data;
}
resetData = () => {
if(sel.value() == 'Old faithful'){
data = oldFaithful;
kmeans = new K(data, 2, 3);
} else if(sel.value() == 'Iris Dataset'){
data = iris;
kmeans = new K(data, 3, 3);
} else if(sel.value() == 'World Map'){
data = worldMap;
kmeans = new K(data, 7, 5);
} else {
data = generateData();
kmeans = new K(data, 3, 3);
}
rescale();
}